Live View Summaries
Available from 4.3.0.0
Configurable summaries linking System Queries to Live View Widgets for data aggregation and visual grouping. Colour ranges determine widget appearance based on entity counts falling within defined thresholds.
Supported aggregate functions include Count, Sum, Maximum, Minimum, and Average, enabling flexible numeric analysis and threshold-based colour-coding for real-time data visualization.
Settings > Widgets & Home Pages > Live View Summaries
The link will open the Live View Summaries grid. It is a grid view which can be searched, sorted and customised as normal.
To add a new Live View Summary click New ![]() , to edit an existing Live View Summary click Edit
, to edit an existing Live View Summary click Edit ![]() . A pop up window will appear which will allow the creation or amendment of a Live View Summary.
. A pop up window will appear which will allow the creation or amendment of a Live View Summary.
 Click to view - Live View Summaries Fields and Descriptions
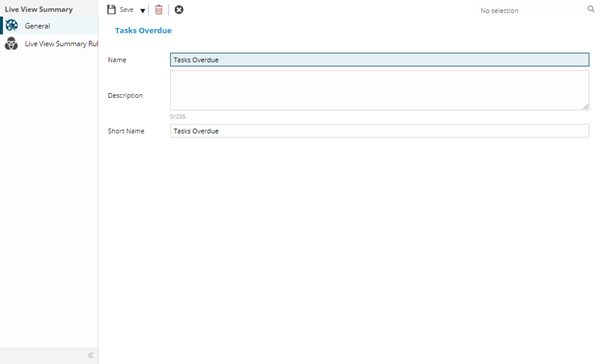
Complete the fields and click Save ![]() . Once the Live View Summary header has been completed and saved a sub navigation will appear to allow additional entities to be created.
. Once the Live View Summary header has been completed and saved a sub navigation will appear to allow additional entities to be created.
These include:
- Live View Summary Rules
Live View Summary Rules
Live View Summary Rules allow the colouration rules to be set. Once the Summary has been created colour ranges can be added to determine the colour a summary will turn in the Live View Widget if met.
Settings > Widgets & Home Pages > Live View Summaries
Click to view - Live View Summary Rules Fields and Descriptions
To add colour ranges click New ![]() , a new colour range will be added to be configured.
, a new colour range will be added to be configured.