Widget - Live View
Available from 4.3.0.0
Geographical visualization widget displaying entity locations and counts on floor plan maps. Supports Tasks, Assets, Stock, Bookings, and Location data with configurable zones, queries, summaries, and KPI banners.
Typical deployment uses wall monitor dashboards providing visual entity status maps without requiring user login, with automated cycling through defined zones and summaries.
 Available from 7.0.0.0
In previous versions, the Queries sub-navigation section only allowed the assignment of Queries that are based upon five system entities; Facility Bookings, Tasks, Locations, Assets and Stock.
This limitation has been enhanced to include other system entities that have direct foreign key links to Locations:
-
Asbestos Containing Materials
-
Contacts
-
Work Permits
Settings > Widgets & Home Pages > Widgets > Widget - Live View
The link will open the Widgets grid. It is a grid view which can be searched, sorted and customised as normal.
To add a new Widget click New ![]() , to edit an existing Widget click Edit
, to edit an existing Widget click Edit ![]() . A pop up window will appear which will allow the creation or amendment of a Widget.
. A pop up window will appear which will allow the creation or amendment of a Widget.
Select the Widget template : Live View. Complete the fields and click Save ![]() . Click Configure Widget
. Click Configure Widget ![]() .
.
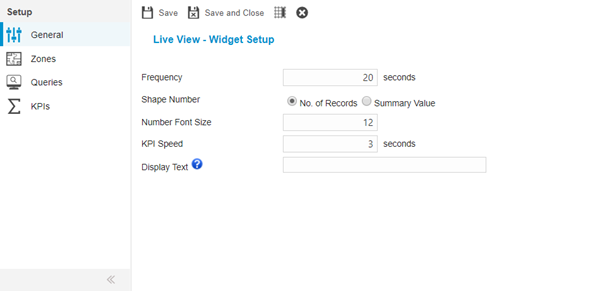
 Click to view - Live View Fields and Descriptions
Complete the fields and click Save ![]() . Once the Live View header has been completed and saved a sub navigation will appear to allow additional entities to be assigned.
. Once the Live View header has been completed and saved a sub navigation will appear to allow additional entities to be assigned.
These include:
- Zones
- Queries
- KPIs
Zones
Zones need to be assigned to the Live View Widget. Multiple Zones can be assigned, the widget will move through each Zone showing summaries and KPIs
Settings > Widgets & Home Pages > Widgets > Widget - Live View
The link will open the Live View Widget / Zones grid. It is a grid view that can be customised and sorted as normal.
To assign Zones click Assign ![]() , entities in the right hand assignment window are connected.
, entities in the right hand assignment window are connected.
Queries
Queries need to be assigned to the Live View widget to gather the required data, Live view summaries are assigned to each query to determine colouration and summary.
Only Queries that are based upon the following system entities are available to be assigned to the Live View widget:
-
Facility Bookings
-
Tasks
-
Locations
-
Assets
-
Stock
-
Asbestos Containing Materials -
Available from 7.0.0.0 -
Contacts -
Available from 7.0.0.0 -
Work Permits -
Available from 7.0.0.0
Settings > Widgets & Home Pages > Widgets > Widget - Live View
The link will open the Live View Widget / Queries grid. It is a grid view that can be customised and sorted as normal.
To assign Queries click Assign ![]() , entities in the right hand assignment window are connected.
, entities in the right hand assignment window are connected.
Once the query has been assigned double click on it to assign Live View Summaries.
To assign Live View Summaries click Assign ![]() , entities in the right hand assignment window are connected.
, entities in the right hand assignment window are connected.
KPIs Sub Navigation
A KPI banner is displayed within the Live View Widget. This enables further numeric information to be displayed in addition to the Zone related Query and Summary data. A KPI can show data relating to Maximum, Minimum, Count, Sum or Average Values. Any MRI Evolution entity can be chosen, these can either be linked to a Query or can stand alone to display separate information.